This year FEBA started working on quantifying the impact of European Food Banks. The activity is made of three milestones:
- Definition of common KPIs, dataset structure and data collection strategies;
- Development of an Observatory on food donation;
- Promotion and dissemination of the Observatory on food donation.
WORKSHOP 1 / Let’s start laying solid foundations
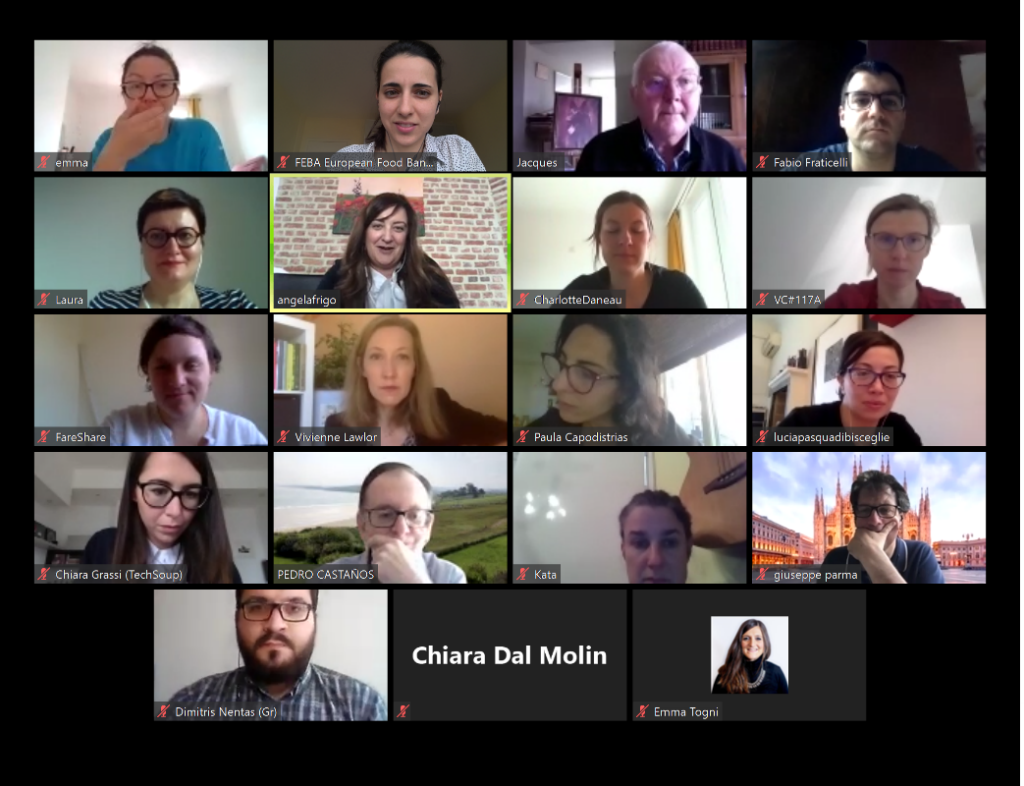
On 6-7 April 2020, the European Food Banks Federation organized the Workshop 1 of the project “Quantifying the Impact of European Food Banks – From Farm to Fork”. It was organized in collaboration with FoodCloud and took place virtually.
The first online workshop for the Pilot Group took place with the main objective to identify common KPIs, share a standardized and consistent methodology for data collection across Food Banks, and define how to make sense of the information of impact management and measurement.
In this workshop participants were guided by the leading team to go into more detail with the topic of KPIs by asking three questions:
- What do we have? Overview of the indicators that Food Banks already use or have today.
- What indicators are we missing and what do we need? With respect to the areas of impact to monitor (economic, social, nutritional, environmental), participants discussed on the sets of indicators that are still considered inadequate, problematic, absent, as well as on what are the missing ones.
- How can data look like once operationalized in the database? A first platform’s web frame proposal was presented to participants.
The presentations from experts – Vivienne Lawlor from FoodCloud and John McGrath from IBM – were inspiring, especially to have a broader and challenging vision during these first steps of the project.
Read the report of the workshop here.
WORKSHOP 2 / Make Data Speak
The second online workshop focused on communication and on “make data speak”. It was organized by FEBA and took place virtually. The workshop was structured as an umbrella session, under which, three main messages found place:
- Make data speak means first of all boost internal awareness, benchmarking and bench learning (within FEBA network)
- Data should speak the language of recipients; this means planning dedicated communication to the diverse stakeholders.
- Good Information with sound data and effective stories can help fund raising.
Data for Good: using our data to tell a story. Vivienne Lawlor, Head of Communications at FoodCloud, presented a case study of the communications journey and process that FoodCloud took to create a communication campaign for Covid-19 emergency food and funding appeal and the role that data played throughout the journey from communications messaging to campaign analysis.
From Vivienne’s presentation emerged that communication is both strategic and tactical.
While communicating in the two manners, Food Banks must keep coherent to their mission and values.
Moreover, the presentation of Emma Togni, Marketing Manager, TechSoup Italy on “Social Media trends & Tips” was a precious occasion to have a comprehensive framework on what it is called digital communication, in particular social media communication.
A story half-told. Bruce Learner, Senior Manager CSR & Partnerships, Kellogg Europe Bruce opened the floor to a really stimulating discussion on what are the data and information that enterprises are really interested in when talking about food recovery and redistribution underlying what lacks from the information communicated by Food Banks across Europe.
Fabio Fraticelli, COO of TechSoup Italy, concluded the online workshop underlying the assumption that good data, once collected and elaborated, deserve an effective visualization. FEBA is looking for a tool which is easy to be used, flexible, customizable, and not too time consuming for its users.
From the next workshop onwards, vertical discussions will be organized on the indicators related to a specific area of impact: economic, social, nutritional, and environmental.
In the meantime, the agile approach to the implementation of the platform will proceed, including the indicators step by step selected together with the Pilot Group.
To have a complete overview of the project and to download the different reports, please visit the dedicated webpage here.


